
p = 0.047 — significant, but is it meaningful? That's the question most courses never teach you to ask.
Do you actually understand your p‑values, or do you just check if they're under .05?
Most statistics courses teach you to pass tests. Sigma teaches you to think — through real datasets, honest ambiguity, and the exact gaps your background left behind.
Free · 3 minutes · Personalized results
2,847
Analysts enrolled
94%
Pass rate, cohort 4
Apr 14
Next cohort opens
Find your exact statistical gaps in 3 minutes
Five questions across probability, hypothesis framing, and regression. Your answers reshape which sections you see next — the curriculum reorganizes itself around what you actually need.
Probability Intuition
Hypothesis Framing
Regression Logic
The Sigma Curriculum
Five modules. Every one built around
real confusion.

Update beliefs the right way — before the data, not after
Bayesian Reasoning from Scratch
Most analysts treat probability as a frequency. Bayesian thinking treats it as a degree of belief — and once you see the difference, frequentist p-values never quite look the same. We start with Bayes' theorem on a coin flip, build to conjugate priors, and land on practical posterior estimation for real business decisions.
You'll be able to
Construct and update priors from domain knowledge
Interpret posterior distributions without a PhD
Know when Bayesian > frequentist for your problem

The difference between a result and a finding
Experimental Design That Actually Works
An A/B test with p = 0.03 and an effect size of 0.2% is not a win — it's a warning. This module covers randomization, control conditions, confounders, and the pre-registration habits that separate rigorous experiments from expensive noise. Built around real marketing, product, and clinical cases.
You'll be able to
Design experiments that answer the question you actually have
Spot confounders before they ruin your analysis
Distinguish statistical from practical significance every time

The most misquoted concept in applied statistics
Confidence Intervals Without the Confusion
If you've ever said "there's a 95% chance the true value is in this range," this module is for you — and so is everyone you've ever briefed. We deconstruct what intervals actually mean, why the frequentist interpretation is philosophically uncomfortable, and how to communicate uncertainty to non-statisticians without losing the rigor.
You'll be able to
State the correct interpretation of a CI in plain language
Build CIs for means, proportions, and regression coefficients
Explain uncertainty to stakeholders who don't want to hear it
Read SPSS output without wanting to close the laptop
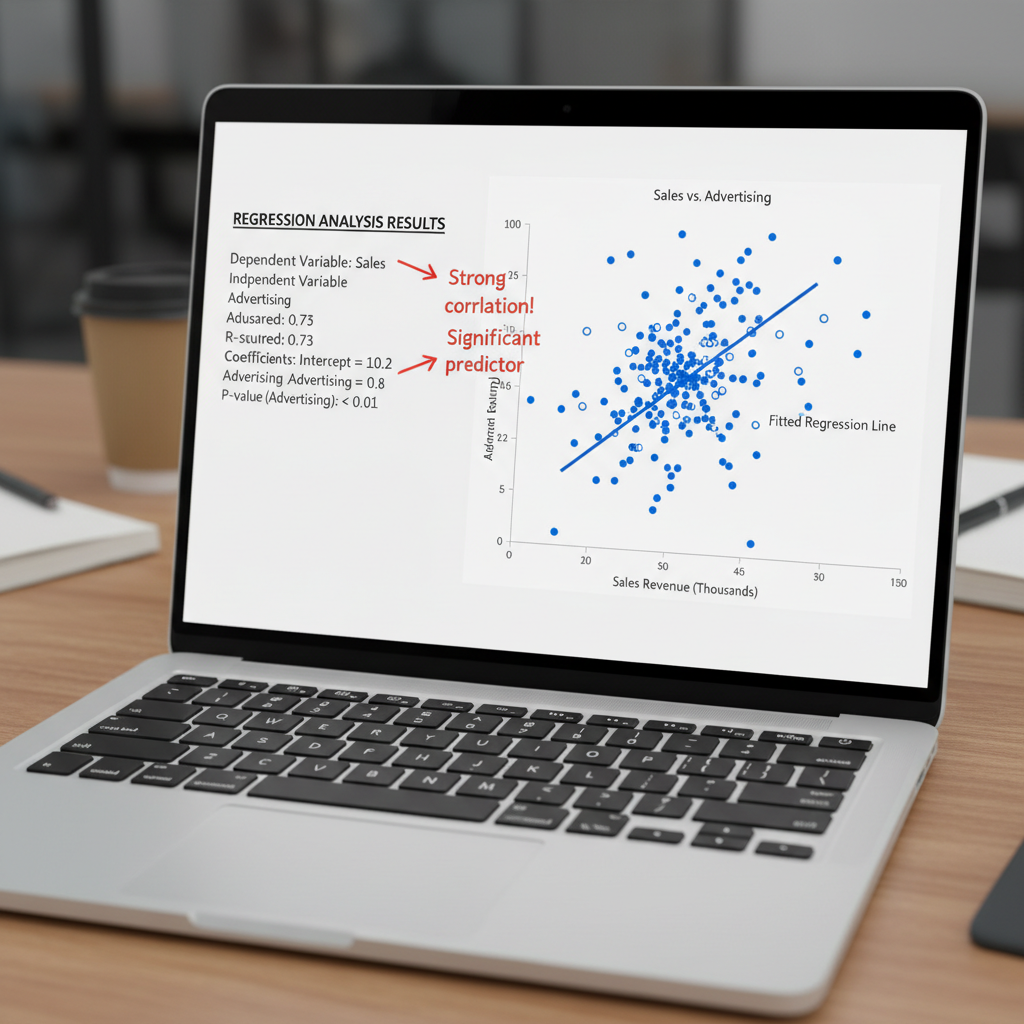
Regression Interpretation, Line by Line
Coefficients, standard errors, interaction terms, residual plots — every row of a regression table tells a story, and this module teaches you to read it. We work through multiple regression, dummy coding, and interaction effects using messy real-world data, the kind that never looks like a textbook example.
You'll be able to
Interpret coefficients in context, including interactions
Diagnose assumption violations from residual plots
Explain regression results to a non-technical audience

You can't test what you haven't precisely stated
Hypothesis Framing That Holds Up
Null hypothesis: "the intervention has no effect" is not a hypothesis — it's a wish. This module covers formal hypothesis construction, one-tailed vs. two-tailed tests, Type I and Type II errors, and the power analysis that tells you whether your study was worth running before you ran it.
You'll be able to
State null and alternative hypotheses with parameter precision
Choose the right test for your data structure
Run and interpret power analysis before data collection
Who Teaches This
Built by people who've been lost in the output and found their way

Dr. Priya Mehta
Lead Instructor
Priya spent six years as a senior statistician at Nielsen before joining Spotify's experimentation platform team. She's run over 400 A/B tests, reviewed thousands of regression outputs, and mentored analysts who arrived knowing only that p < 0.05 was "good."
She built Sigma because every course she found either skipped the hard parts or buried them in notation. "The gap isn't math," she says. "It's never having been shown what the math is actually for."
From Past Cohorts
"I passed my data science interview at Stripe. The Bayesian module was the exact thing they tested — I'd never understood it before Sigma."

Marcus Webb
Analyst → Data Scientist, Stripe
"My SPSS output used to terrify me. Now I annotate it in meetings and explain the interaction effects. My advisor actually asked where I learned that."

Kezia Okonkwo
PhD Candidate, UCL Epidemiology
12cohorts
run since 2023
94%
completion rate
3.2×
average salary increase reported
400+
A/B tests designed by Priya personally
Spring 2026 Cohort — Starts April 14
Reserve your seat
before the cohort fills


23 seats remaining of 40
Cohort Details
Start Date
Monday, April 14, 2026
Duration
6 weeks, 3 hours/week
Cohort Size
Max 40 — intentionally small
Format
Live sessions + async exercises
Certificate
Issued on completion + portfolio project
"I downloaded the diagnostic report on a Thursday night. By Sunday I'd enrolled. The PDF showed me exactly what I'd been faking for three years."
Tomás Reyes
Marketing Analytics Manager, CDMX